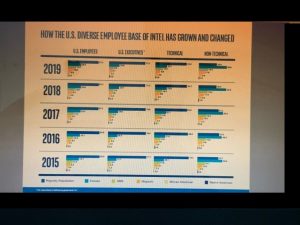
Intel released its 2019 Diversity and Inclusion Report this week, and there were some notable changes in ‘how the U.S. employee base has grown and changed.’ According to the report, the percentage of employees in the majority population (White or Asian males) dropped from 66.0% in 2015 to 64.9% (2016), and then 62.5% in 2017 with a slight change in 2018 (62.2%) and 61.2% in 2019.
The number of White and Asian executives reflected the same change year on year since 2015 (77.7%), 76.0 (2016), 74.9% (2017), 72.3% (2018), and 72.5 (2019).

However, the total number of males and females who identify as having Native American lineage has seen little change over the same five-year period.
Starting at 0.5% (2015), there was a slight uptick in 2016 (0.6%), and 2017 (0.7%), rising to 0.8% in 2019. There were almost the same numbers of Native Americans in executive positions and in the technical workforce (2015-2019).
In contrast, employees who identify as having Hispanic heritage held more positions in roles that are technical in nature, such as engineers, as well as roles that are non-technical in nature, such as marketing, human resources (HR), legal, and other support functions.
In 2019, Latinos make up 10.0% percent of Intel’s population, rising incrementally from 8.3% (2015) to 8.7% (2017) and 9.2% (2018). More than 5 percent of executives are Hispanic, with 9.9% in technical roles and 11.6% in non-technical roles.

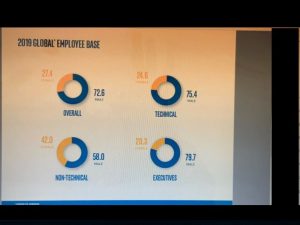
According to Barbara Whye, chief diversity and inclusion officer and vice president of human resources, there’s been a decline in overall U.S. Female representation from 26.8% to 26.5% although worldwide representation of women overall increased by 0.1% last year and women in director-level positions increased by 0.6% due to their focus on global leadership representation.
Whye has a bachelor’s degree in electrical engineering, an MBA and is currently pursuing a Ph.D. in Human and Social Dimensions of Science and Technology at Arizona State University.
Although the total African American population at the technology company has risen year on year, from 3.5% (2015) to 3.7% (2016), 3.9% (2017), 4.6% (2018) and 4.9% in 2019, the numbers of males and females who identify as having African American heritage in executive positions has seen a slower rise, fluctuating between 2.3% (2019, 2015), 2.4% (2018, 2017), and 2.5% in 2016.
The numbers of African Americans in roles that are technical in nature, such as engineers, show promising signs.
• 4.8% (2019)
• 4.5% (2018)
• 3.7 (2017)
• 3.5 (2016)
• 3.3 (2015)
Click here to read the full report.
The U.S. Army Corps of Engineers has been tasked with…
Brown and Caldwell, a leading environmental engineering and construction firm,…
Humboldt State University, one of four campuses within the California…